Mass Spectrometry – Qualitative Analysis
Introduction to Mass Spectrometry
⚗️ Mass Spectrometry is a powerful analytical technique used to measure the mass-to-charge ratio (m/z) of ions. It is particularly useful for:
Applications of Mass Spectrometry:
- Determining molecular masses of compounds
- Analyzing relative abundances of isotopes
- Elucidating molecular structures through fragmentation patterns
- Identifying elements like chlorine and bromine in compounds
- Studying reaction mechanisms
/>
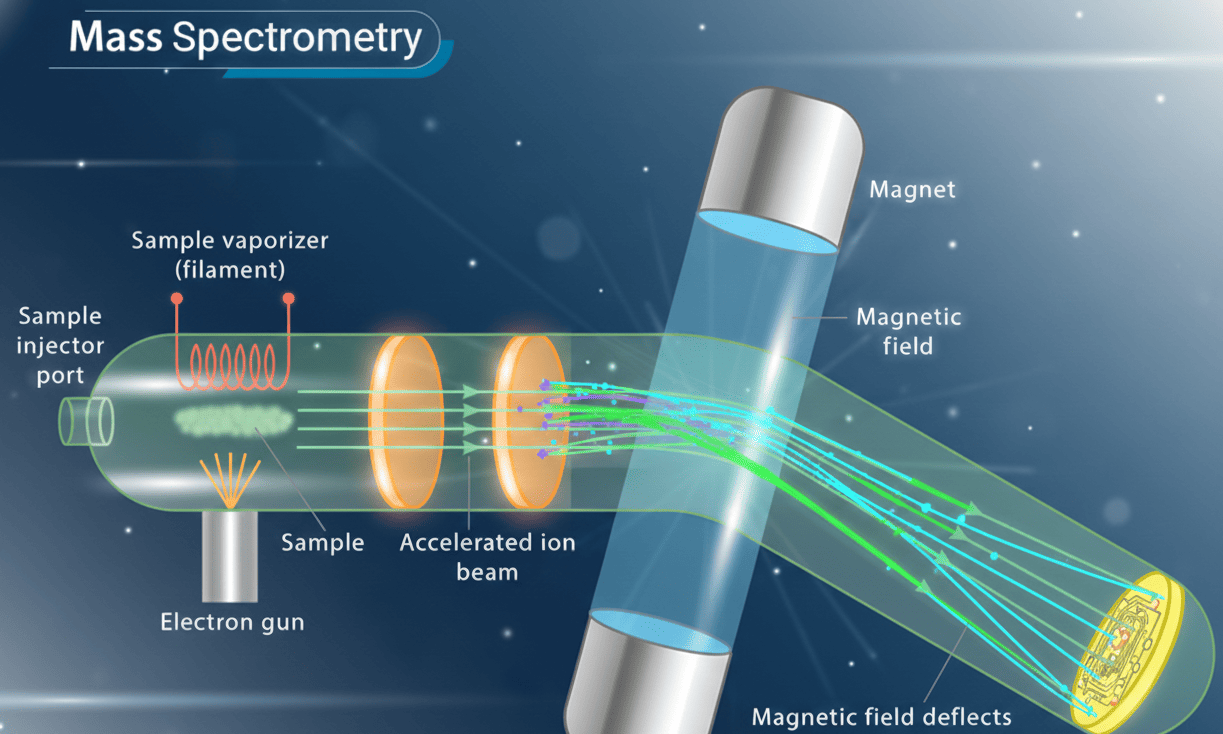
Mass Spectrometry Instrument Diagram
Key Concept:
In mass spectrometry, molecules are ionized and then separated based on their mass-to-charge ratio (m/z). The resulting spectrum provides valuable information about the compound’s composition and structure.
Analyzing Isotopes and Relative Abundances
Identifying Isotopes from Mass Spectra
📊 The number of peaks in a mass spectrum at proper m/z values indicates the number of isotopes present in an element.
Examples:
- Chlorine: Two peaks in the mass spectrum indicate two isotopes (Cl-35 and Cl-37)
- Hydrogen: Three peaks indicate three isotopes (protium, deuterium, and tritium)
- Boron: Two peaks indicate two isotopes (B-10 and B-11)
The height of each peak represents the relative abundance of each isotope as a percentage.
Mass Spectrum of Boron
| Mass Number | Relative Abundance (%) |
|---|---|
| 10 | 19.90% |
| 11 | 80.10% |
Calculating Relative Atomic Mass
🧮 The relative atomic mass of an element can be calculated using the formula:
Atomic Mass Calculator
Example: Boron
Using the data from the mass spectrum:
Avg. Atomic mass of Boron = (10 × 19.90) + (11 × 80.10) / 100 = 10.801 amu
Molecular Mass Determination
Identifying the Molecular Ion Peak
🔍 The molecular ion peak (M⁺) is the peak in a mass spectrum that represents the molecular ion. It has the highest m/z value (excluding heavier isotope peaks).
Characteristics of Molecular Ion Peak:
- Represents the intact molecule with one electron removed (M⁺)
- Has the highest m/z value in the spectrum (excluding isotope peaks)
- The m/z value equals the molecular mass of the compound
- May be small or absent for compounds that fragment easily
Mass Spectrum of Ethene (C₂H₄)
Important Note:
The base peak is the most intense peak in the spectrum (assigned 100% relative abundance). It may or may not be the molecular ion peak.
M+1 and M+2 Peaks
📈 In addition to the molecular ion peak, mass spectra often show M+1 and M+2 peaks due to the presence of heavier isotopes.
M+1 Peak:
- Caused by the presence of ¹³C isotope (natural abundance ~1.1%)
- Appears at one m/z unit higher than the molecular ion peak
- Intensity depends on the number of carbon atoms in the molecule
M+2 Peak:
- Caused by the presence of two ¹³C atoms or other heavier isotopes
- Appears at two m/z units higher than the molecular ion peak
- Usually much smaller than M and M+1 peaks
Mass Spectrum showing M, M+1, and M+2 peaks
Fragmentation Patterns and Structural Elucidation
Understanding Fragmentation
⚡ When molecules are bombarded with electrons in the mass spectrometer, they undergo fragmentation. The weakest bonds break first, forming the most stable fragments.
Common Fragmentation Patterns:
- m/z = 15: CH₃⁺ (methyl cation)
- m/z = 29: CH₃CH₂⁺ (ethyl cation)
- m/z = 43: CH₃CH₂CH₂⁺ (propyl cation)
- m/z = 57: C₄H₉⁺ (butyl cation)
- m/z = 17: OH⁺ (from alcohols)
- M-15: Loss of CH₃ group
- M-18: Loss of H₂O (from alcohols)
Fragmentation of n-Pentane (C₅H₁₂)
Mass Spectrum of n-pentane
Memorization Tip:
Fragmentation Rule: Weakest bonds break first, forming the most stable carbocations.
Stability of carbocations: tertiary > secondary > primary > methyl
Calculating Number of Carbon Atoms
🔢 The number of carbon atoms in a molecule can be calculated using the relative intensities of the M and M+1 peaks:
Carbon Atom Calculator
Example Calculation:
For a compound with M⁺ peak abundance = 27.32% and M+1 peak abundance = 2.10%:
Number of carbon atoms = (100 × 2.10) / (1.1 × 27.32) = 6.94 ≈ 7 carbon atoms
Identifying Chlorine and Bromine in Compounds
Characteristic Isotope Patterns
🔬 Chlorine and bromine have characteristic isotope patterns in mass spectra due to their natural isotopic abundances.
Chlorine Detection:
- M⁺ peak at m/z value corresponding to molecular mass with Cl-35
- M+2 peak at m/z value 2 units higher with approximately 1/3 the intensity (due to Cl-37)
- Example: Chloromethane (CH₃Cl) shows M⁺ at m/z = 50 and M+2 at m/z = 52
Mass Spectrum of Methyl Chloride (CH₃Cl)
Bromine Detection:
- M⁺ peak at m/z value corresponding to molecular mass with Br-79
- M+2 peak at m/z value 2 units higher with approximately equal intensity (due to Br-81)
- Example: Bromoethane (C₂H₅Br) shows M⁺ at m/z = 108 and M+2 at m/z = 110
Mass Spectrum of Ethyl Bromide (C₂H₅Br)
Identification Tip:
Look for characteristic M+2 peaks with specific intensity ratios to identify chlorine (≈1:3) or bromine (≈1:1) in organic compounds.
Advanced Applications
Reaction Mechanism Studies
🔍 Mass spectrometry can be used to study reaction mechanisms by identifying intermediate cations and fragment ions formed during chemical reactions.
Applications in Mechanism Studies:
- Identification of reactive intermediates
- Tracking the pathway of complex reactions
- Studying rearrangement reactions
- Analyzing reaction kinetics
Analytical Advantage:
Mass spectrometry provides direct evidence for the presence of specific ions and fragments, offering insights into reaction pathways that are difficult to obtain by other methods.
Quick Quiz
Quick Navigation
- Introduction
- Isotopes & Abundances
- Molecular Mass
- Fragmentation
- Cl & Br Detection
- Advanced Applications
- Quiz